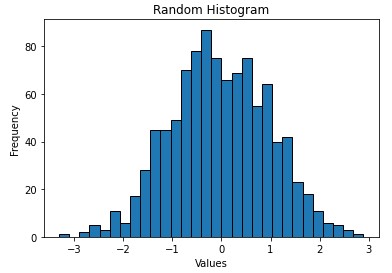
Hey, I recently became familiar with the concept of histograms and their use in Data Analysis in my course at university, but my teacher didn’t provide me with code to plot it on my own using Jupyter and explore it more and when I searched for its documentation on the internet, I got completely lost. Can anyone help me plot a simple histogram similar to this?
And also list down every possible customization of the plots if possible.